A
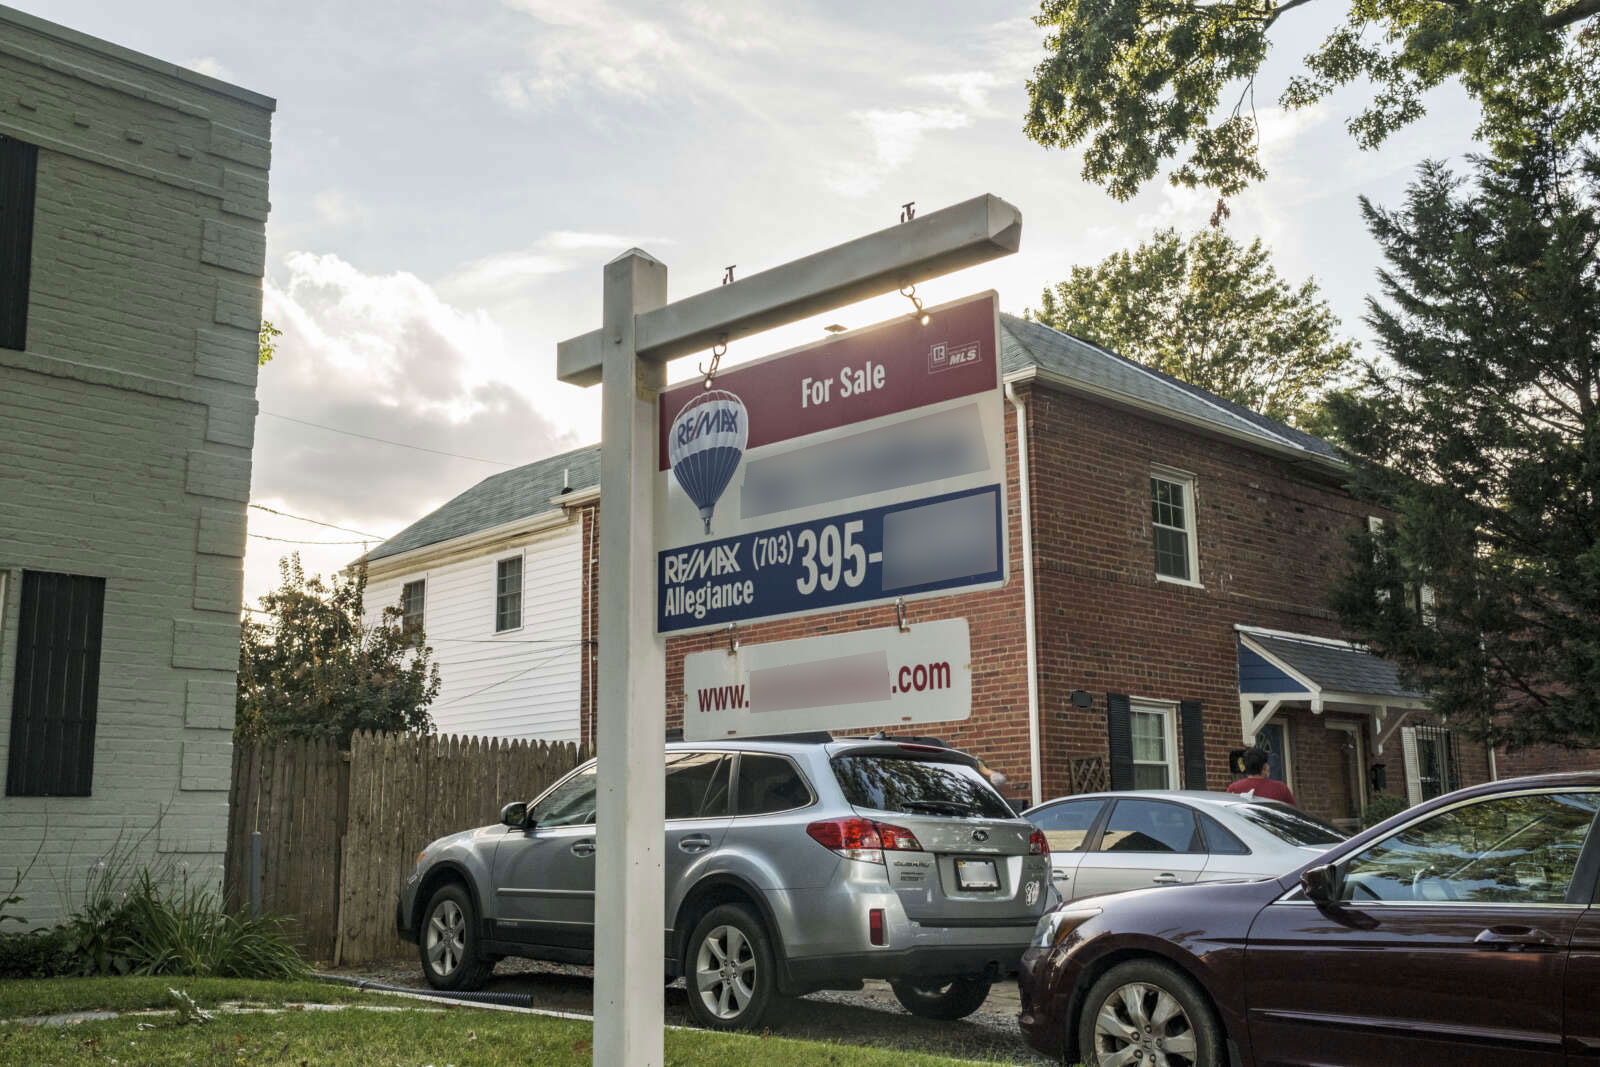
rlington’s October housing market stayed solid amid economic uncertainty and the federal shutdown. The average sale price for detached single‑family homes hovered near $1.5 million—down from the September peak of $1.8 million but still far above the national average of $426,000. Bright MLS reported that 79 detached properties closed last month at an average of $1,446,964, a 10.8 % rise from October 2024.
Overall, 191 residential transactions occurred in Arlington, a 9 % increase over September’s 175. The average sale price for all homes was $958,153, up 19 % year‑over‑year. Detached single‑family homes accounted for 41.3 % of sales, up from 29.1 % a year earlier. Attached homes averaged $610,329, up 4.8 %; condominiums averaged $423,903, down 3.9 %.
The market’s per‑square‑foot cost averaged $503 in October, slightly above the $500 of September and $496 a year ago, matching the year‑to‑date average of $504. Total sales volume reached $183.5 million, a 30.7 % jump from the previous year’s $140.4 million.
Homes spent an average of 32 days on the market, up from 26 days a year earlier, and sold for 97.3 % of their listing price, down from 99.3 %. At month‑end, 472 properties were listed countywide, a 64 % increase from the same period last year. Most closings were contracts signed before the federal shutdown began on Oct. 1; economic concerns linger despite the shutdown’s expected end.
Lisa Sturtevant, Bright MLS chief economist, noted that while the D.C. area remains resilient, cracks appear. “Mortgage rates are at their lowest in 13 months, yet buyers remain cautious, watching economic headlines and their own finances,” she said. Northern Virginia saw positive activity, whereas D.C. and inner‑Maryland suburbs experienced declines. Year‑over‑year sales were essentially flat—4,201 in Oct. 2025 versus 4,207 in Oct. 2026—according to MarketStats by ShowingTime; figures are preliminary.
D.C. prices fell more sharply than the national average: a 3.6 % quarterly decline versus 0.6 % nationwide. The region’s median single‑family price was $657,200 in Q3, down from $681,900 in Q2. Nationally, the median was $426,000 in Q3, slightly below $428,500 in Q2. Despite these quarterly drops, median prices rose YoY—2.3 % in the D.C. region and 1.7 % nationally. Seventy‑seven percent of 230 tracked metros posted YoY gains, with 4 % enjoying double‑digit increases.
Regional median existing‑home prices rose YoY as follows: Northeast +6.0 %, Midwest +4.2 %, South +0.5 %, West –0.1 %. NAR chief economist Lawrence Yun explained that supply‑constrained Northeast and affordable Midwest markets drive stronger appreciation, while southern states see declines amid robust new‑home construction.
The ten most expensive U.S. markets in Q3 were: San Jose‑Sunnyvale‑Santa Clara ($1,915,000; +0.8 %), Anaheim‑Santa Ana‑Irvine ($1,400,000; +0.1 %), San Francisco‑Oakland‑Hayward ($1,315,000; +0.5 %), Urban Honolulu ($1,127,900; –0.9 %), Salinas ($1,019,900; +6.3 %), San Diego‑Carlsbad ($1,009,500; 0.0 %), Los Angeles‑Long Beach‑Glendale ($954,100; +0.7 %), Oxnard‑Thousand Oaks‑Ventura ($935,700; –1.2 %), San Luis Obispo‑Paso Robles ($931,800; –1.9 %), and Bridgeport‑Stamford‑Norwalk ($844,900; +7.8 %). Fourth‑quarter data will be released Feb. 4.
A recent Virginia Realtors survey of 1,011 members (718 with recent transactions) projected a cool winter season. Expected buyer activity for late January to early February scored 13/100, the lowest of the year, while seller activity was 15/100, the lowest since January. Twenty‑three percent anticipated price increases, 43 % expected declines, and 25 % saw no change. The slow period aligns with typical late‑December to early‑February market lulls; the survey did not break down sentiment by region.