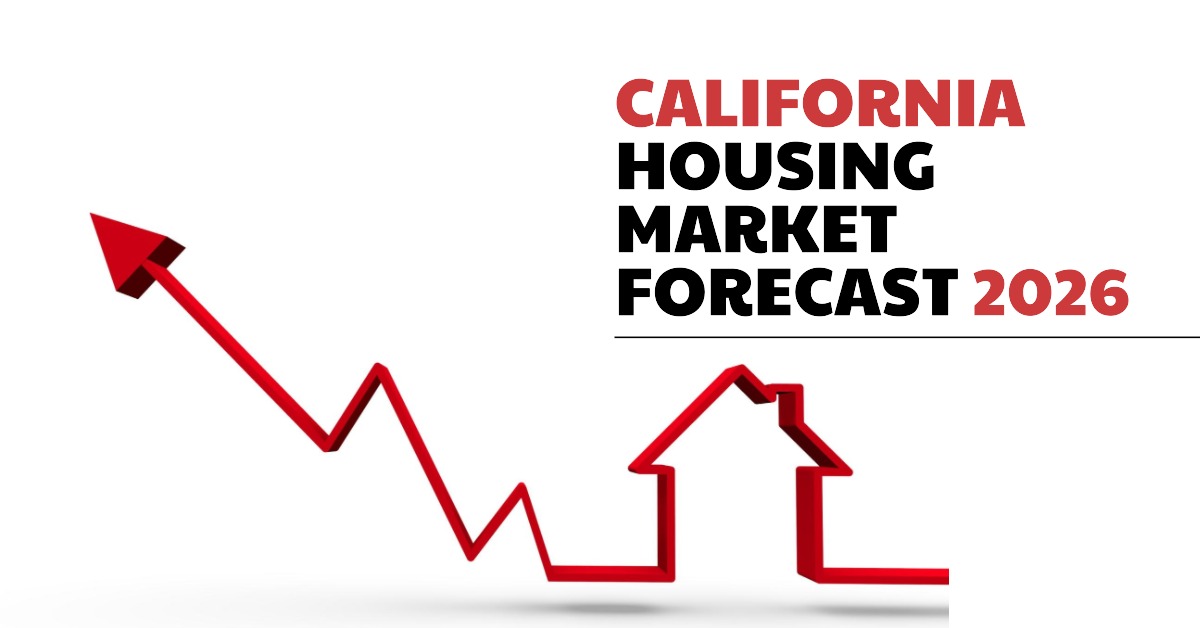
C
alifornia’s 2026 housing outlook signals steady, not explosive, growth.
- **Sales**: Existing single‑family homes are projected to rise 2 % to about 274,400 units, up from 269,000 in 2025.
- **Prices**: The median price is expected to hit a new record of **$905,000**, a 3.6 % jump from 2025’s $873,900.
- **Affordability**: The Housing Affordability Index climbs to **18 %** (from 17 % in 2025 and 16 % in 2024), reflecting a modest easing of mortgage costs.
- **Mortgage rates**: The average 30‑year fixed rate is forecast at **6.0 %** in 2026, down from 6.6 % in 2025.
- **Inventory**: Active listings are projected to increase by nearly 10 %, moving toward pre‑pandemic levels.
### Economic backdrop
- **GDP growth**: U.S. GDP is expected to grow 1 % in 2026, slightly slower than 1.3 % in 2025.
- **Employment**: California’s non‑farm job growth is modest at 0.3 %, with unemployment projected at 5.8 %.
- **Inflation**: Consumer prices are projected to rise about 3.0 % in 2026, up from 2.8 % in 2025.
These moderate macro trends help temper price swings, supporting the forecasted stability.
### Market dynamics
- **Buyer impact**: Lower rates and higher inventory give buyers more leverage and a broader selection.
- **Seller outlook**: While prices will rise, the pace is gentle; well‑priced, well‑presented homes will still attract interest, but sellers should expect a more measured sales cycle.
### Potential headwinds
- **Trade tensions** between the U.S. and partners.
- **Home‑insurance crisis** affecting coverage costs and buyer confidence.
- **Stock‑market volatility** that could dampen consumer sentiment.
### Takeaway for 2026
The market is moving from past volatility toward a sustainable, predictable trajectory. Buyers can capitalize on improved affordability and inventory, while sellers should set realistic expectations and focus on presentation. Strategic, informed decisions will be key in this balanced environment.
| Metric | 2024 | 2025 (Proj.) | 2026 (Forecast) | % Change 2025‑26 |
|--------|------|--------------|-----------------|------------------|
| SFH Resales (000s) | 269.2 | 269 | 274.4 | +2.0 % |
| Median Price ($000s) | 865.4 | 873.9 | 905.0 | +3.6 % |
| Housing Affordability Index | 16 % | 17 % | 18 % | — |
| 30‑yr FRM (%) | 6.7 | 6.6 | 6.0 | — |
*Affordability Index: % of households able to afford a median‑priced home.*