C
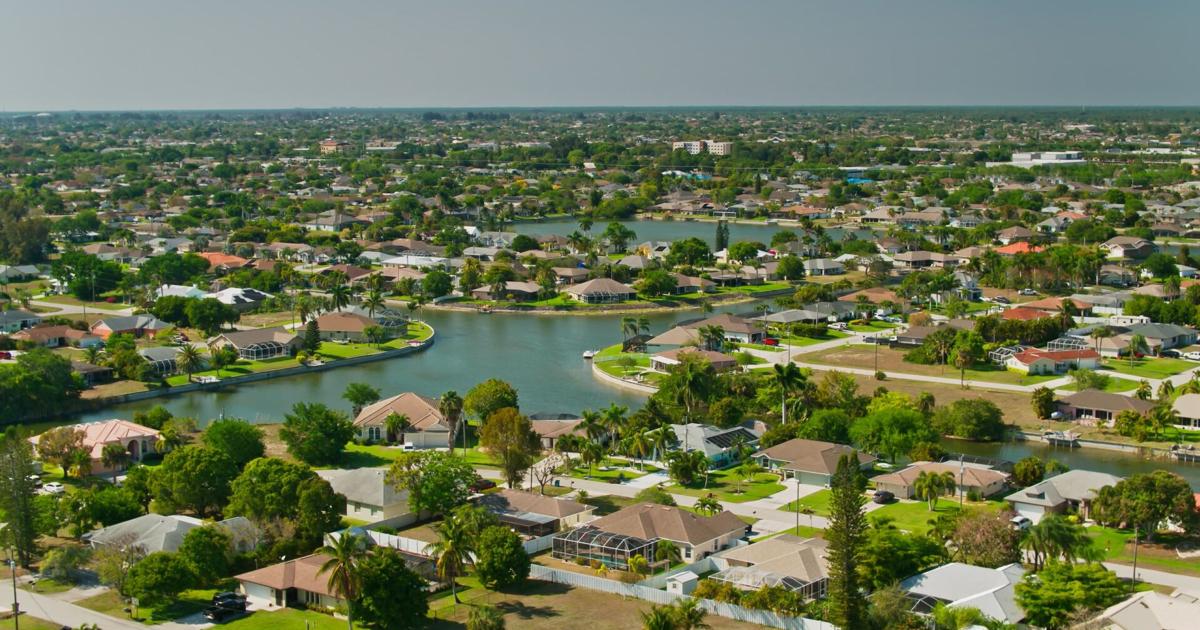
ape Coral remains a top choice for overseas home buyers, ranking 13th nationwide in Realtor.com’s latest International Demand report. The city’s metro area attracted 1.4 % of all U.S. online home‑search traffic from abroad, with Canadian shoppers accounting for 61.4 % of that activity. International visitors also tended to view pricier homes, seeing a median listing of $410,483—about 2.8 % higher than the $399,300 median viewed by domestic buyers.
Despite this local strength, overall foreign interest in U.S. real estate is easing. In Q3 2025, international searches made up 1.5 % of all online U.S. home‑search traffic, a slight drop from 1.6 % a year earlier. The figure still exceeds the 1.2 % share recorded in 2019, indicating that global engagement remains above pre‑pandemic levels. Economist Danielle Hale notes that “global economic uncertainty, policy shifts, and exchange‑rate volatility are creating mixed conditions for international buyers,” which has tempered demand but kept it above historic lows.
Canada continues to dominate U.S. international traffic, though its share has fallen sharply—from 36.6 % in Q3 2024 to 32.1 % this year—due in part to U.S. tariffs on Canadian goods and currency swings that add cost for cross‑border buyers. Canadians, however, still lead in markets such as Phoenix (61 %), North Port (58.8 %), and Detroit (51.4 %).
International buyers consistently favor higher‑priced homes. Across the 20 most popular U.S. metros, the median home viewed by foreign shoppers was 29.8 % more expensive than that viewed by domestic buyers, a narrowing from the 34.2 % average between 2022 and 2024. Los Angeles, New York, San Francisco, and Boston show the largest price gaps, underscoring their status as global luxury hubs. Miami remains the most visited city for international buyers, capturing 8.4 % of foreign online views, followed by New York (5.6 %) and Los Angeles (4.8 %).
Looking ahead, U.S. immigration policy is expected to shape future demand. Proposed “gold” and “platinum” visa programs could attract more high‑net‑worth buyers to luxury markets, while tighter H‑1B restrictions may dampen interest in innovation‑driven metros like Austin and San Jose, according to senior economist Jiayi Xu.
Key metrics for the top 20 markets (Q3 2025):
| Rank | Market | Foreign Traffic Share | Median Viewed (Intl) | Median Viewed (Domestic) | Price Gap |
|------|--------|-----------------------|----------------------|--------------------------|-----------|
| 1 | Miami–Fort Lauderdale–West Palm Beach, FL | 8.4 % | $546,633 | $566,167 | –3.5 % |
| 2 | New York–Newark–Jersey City, NY‑NJ | 5.6 % | $1,029,333 | $690,000 | +49.2 % |
| 3 | Los Angeles–Long Beach–Anaheim, CA | 4.8 % | $3,276,317 | $1,197,667 | +173.6 % |
| 4 | Orlando–Kissimmee–Sanford, FL | 2.7 % | $454,967 | $454,633 | +0.1 % |
| 5 | Dallas–Fort Worth–Arlington, TX | 2.7 % | $543,667 | $484,933 | +12.1 % |
| … | … | … | … | … | … |
| 13 | Cape Coral–Fort Myers, FL | 1.4 % | $410,483 | $399,300 | +2.8 % |
| 20 | San Francisco–Oakland–Fremont, CA | 1.1 % | $1,354,879 | $1,015,933 | +33.4 % |
These figures illustrate that while international interest is cooling overall, certain markets—especially those with strong luxury segments—continue to attract foreign buyers, and Cape Coral remains a notable destination within that landscape.