D
elistings have surged 45.5 % this year, the highest rate in Realtor.com’s three‑year record. In October, 27 % of new listings were withdrawn, a trend that began in June and has persisted for five months, with roughly 6 % of active listings leaving the market each month—levels normally seen only in the slowest winter weeks. Hotspots such as Miami, Denver and Houston show even higher delisting rates.
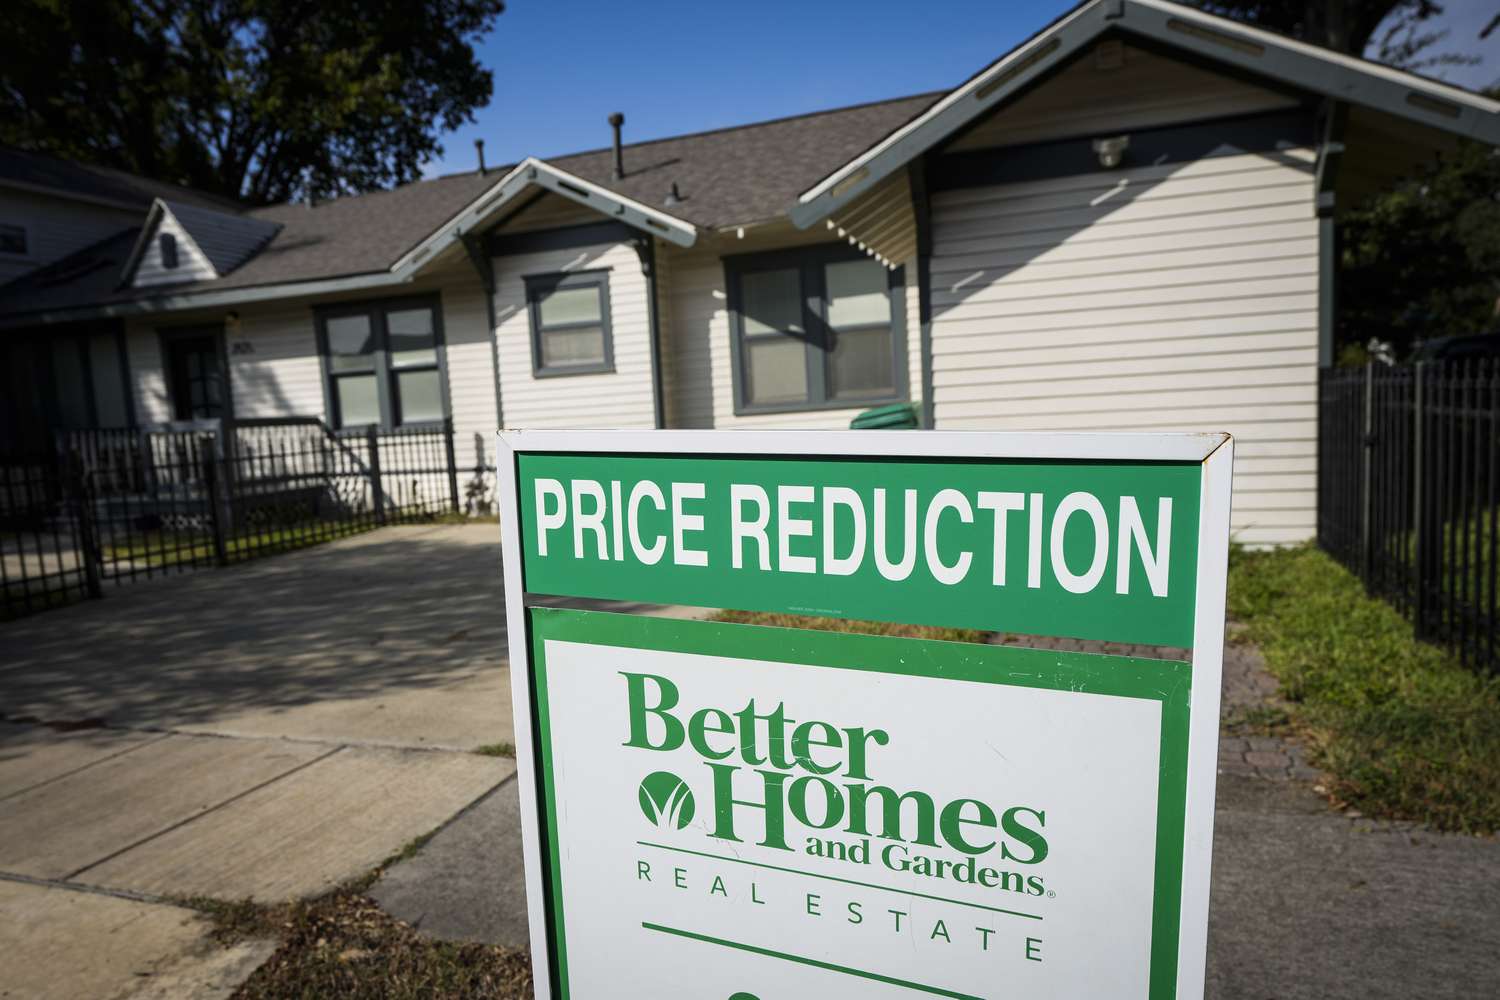
Sellers are pulling homes off the market rather than lowering prices, which have remained flat since 2022. The share of price cuts has risen to 18 %, up about 3 percentage points from pre‑pandemic levels. Despite stagnant sales, active listings have climbed for the 25th straight month, keeping inventory near mid‑summer levels.
The median listing price in November was $415 k, a 36.1 % increase over November 2019 and essentially unchanged from November 2022. Existing‑home sales have hovered near historic lows since the 2022 decline that followed a pandemic‑era price surge.
Higher borrowing costs and steep prices are driving buyers toward more affordable markets, pushing listing prices up in those areas. Since 2022, Milwaukee’s price per square foot has risen 21 %, Cleveland 20.3 %, and Grand Rapids 15.4 %, yet all remain below the national average.
“Many sellers retreat after listing if the market doesn’t meet their price expectations, while buyers are strategically redirecting to metros that remain affordable,” said Danielle Hale, Chief Economist at Realtor.com. “These dynamics reflect how higher rates and years of rapid price growth have rewritten the rules of engagement for both buyers and sellers.”
Delistings signal mounting pricing pressure that can slow sales, curb construction, erode household wealth, and ripple into financial markets, dampening job growth in housing‑related sectors and overall economic momentum.