A
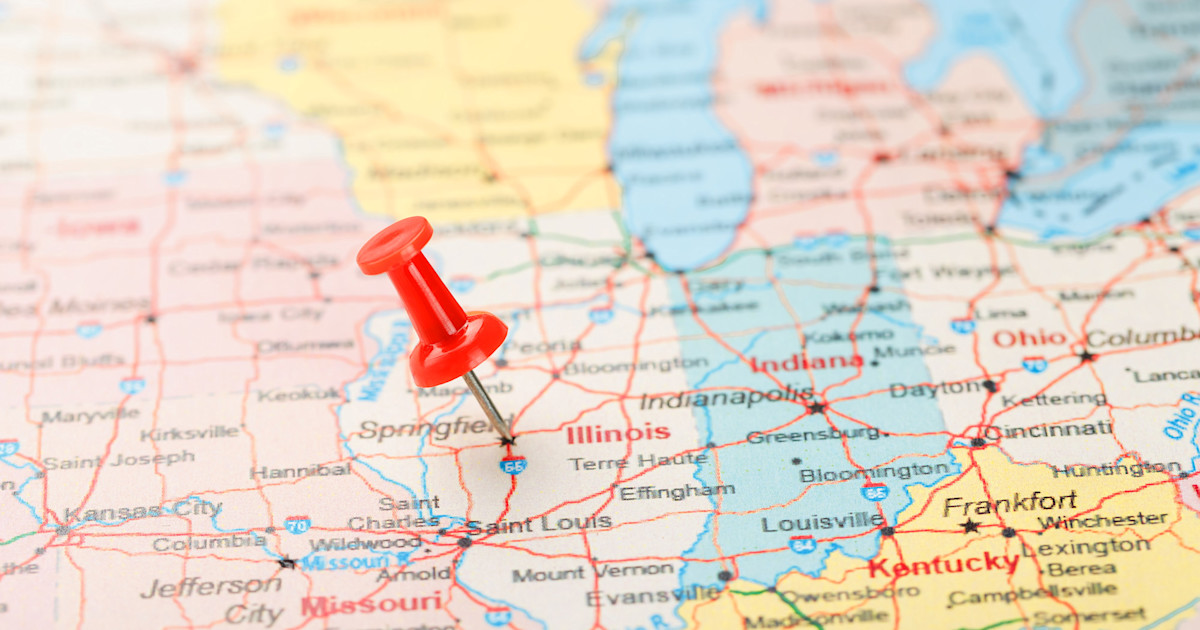
recent report found that the share of people who own their homes has stabilized at around 65%, following a brief COVID-related surge. However, homeownership rates vary significantly by state and city. The top five states with the highest homeownership rates were Maine (74.4%), Michigan (73.7%), Delaware (73.5%), West Virginia (73.3%), and Vermont (73.2%). Conversely, New York had the lowest rate at 54.1%, followed closely by California (55.9%) and Hawaii (62.4%).
A closer look at homeownership rates over time reveals that they peaked in 2004 at just over 69% but began to decline before the Great Financial Crisis. The rate continued to fall for a decade, reaching a low of 62.9% in 2016. However, excluding a brief spike during the pandemic, rates have since stabilized between 65% and 66%. Despite a slight drop between Q3 2023 and Q2 2024, the national homeownership rate remains relatively stable.
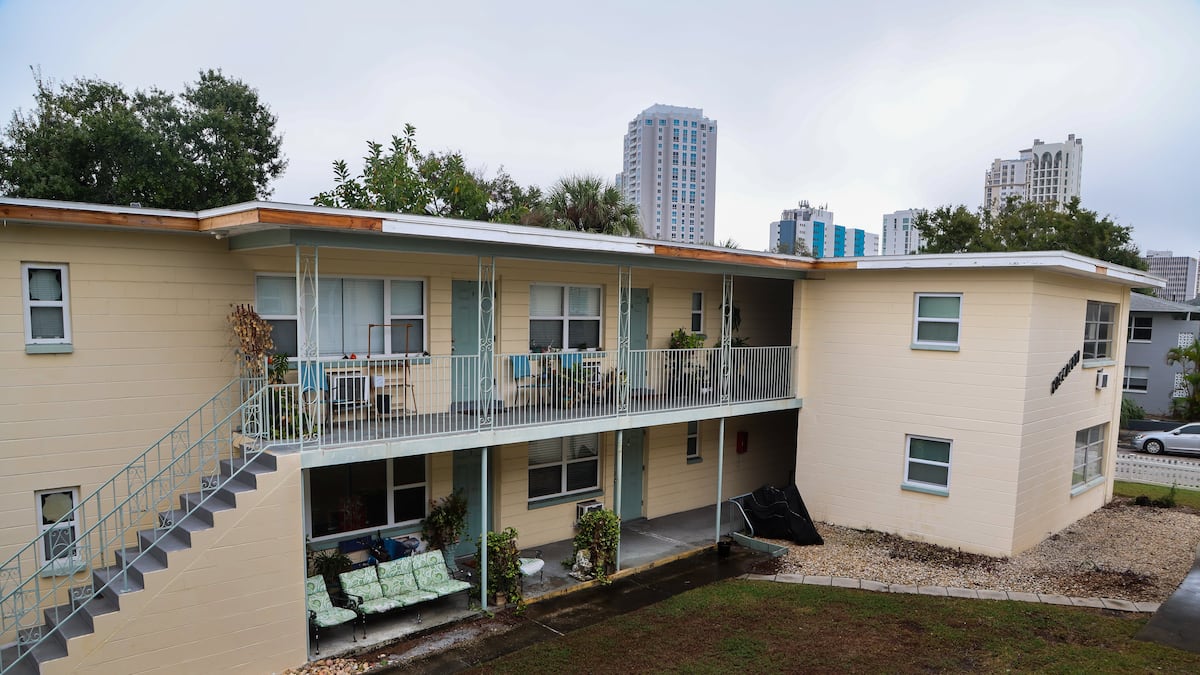
Among cities, Port St. Lucie, Florida, had the highest homeownership rate at 84.9%, while Newark, New Jersey, had the lowest at 24.6%. Notably, high-ownership states like Michigan do not necessarily have high-ownership cities; Detroit, for example, has a homeownership rate of just 53.8%.
Connecticut saw the highest percentage of net in-migration in 2024, accounting for a 1.58% increase in its population. Other popular destinations included South Carolina, Delaware, Florida, and Arizona, each experiencing at least 1% growth from migration. In contrast, New York had the highest rate of out-migration at 1.25%, followed by Maryland, New Jersey, Illinois, and California.