T
he San Diego housing market has been on a wild ride over the past 50 years, marked by booms, busts, and everything in between. As someone who has closely followed this market, I've seen firsthand how it can be both astonishing and bewildering.
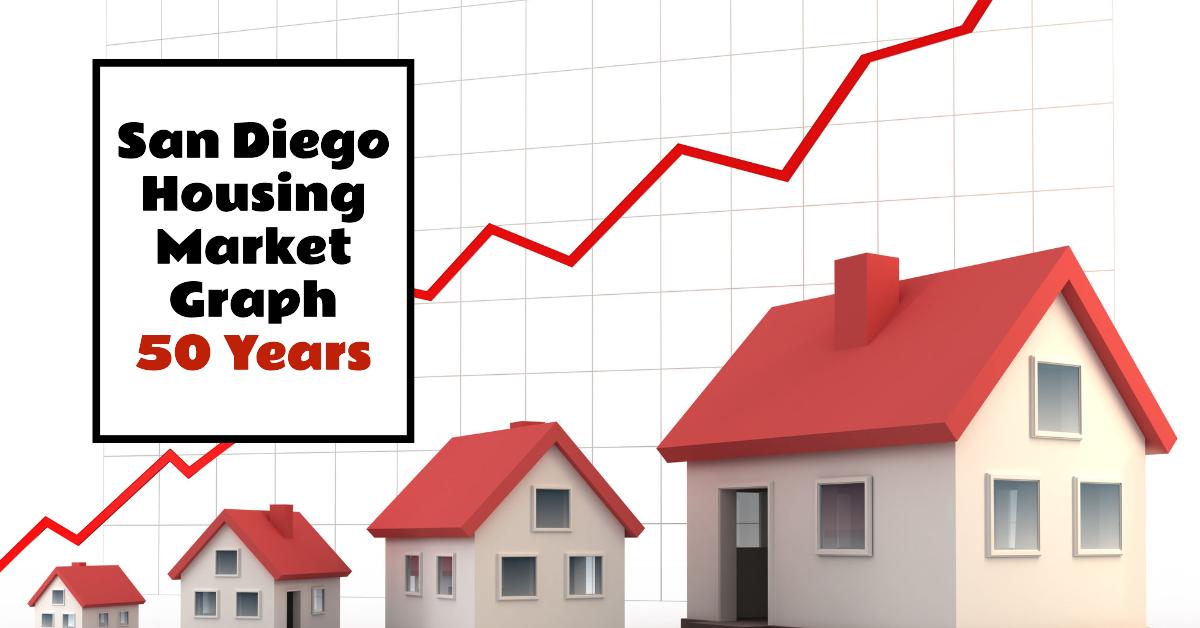
Looking at the All-Transactions House Price Index for San Diego MSA, we see a graph that tells a story of steady growth, shifting sands, and dramatic turns upwards. Here are some key takeaways from each era:
In the 1970s and 1980s, interest rates played a major role in shaping the market. High inflation led to fluctuating interest rates, making it tough for buyers to enter the market. However, as interest rates cooled down in the '80s, homes became more affordable, leading to increased demand and a significant upward swing.
The 1990s and 2000s saw a dramatic turn upwards, driven by the dot-com boom and the rise of the tech industry. Low interest rates made borrowing cheaper, fueling the fire and escalating home prices. By the early 2000s, the market was hot, with properties receiving multiple offers and selling for well above asking price.
However, the global financial crisis led to a sharp downturn in the late 2000s, triggered by the subprime mortgage crisis and the housing bubble bursting. Prices corrected, leading to a steep decline in the San Diego housing market graph.
The recovery was relatively swift, with the market showing signs of life by the early 2010s. Since then, the graph has been characterized by consistent, albeit more measured, growth. The House Price Index has been steadily climbing, driven by limited housing supply and strong economic fundamentals.
Looking at the data from the U.S. Federal Housing Finance Agency, we see a clear picture of the San Diego housing market's journey over the past 50 years. Key data points include:
* 1975: Steady growth with a House Price Index of 25.29
* 1985: Significant upward swing with an index of 66.11
* 2000: Unprecedented upward trajectory with an index of 150.05
* 2005: Peak before the correction with an index of 323.78
* 2010: Beginning of recovery with an index of 222.72
* 2020: Consistent, measured growth with an index of 374.44
* 2023: Continued growth despite rising interest rates with an index of 537.85
Predicting the future of any real estate market is challenging, but by studying historical trends and analyzing current market indicators, we can make some educated guesses. Key things to watch out for include interest rates, inventory levels, and economic conditions.
The San Diego housing market has had its share of ups and downs over the past 50 years, but one thing remains constant: San Diego's desirable location, strong economy, and high quality of life continue to make it an attractive place to live. Understanding the cyclical nature of the market and doing your due diligence is key to navigating this market with confidence.