H
ouse hunters hoping to settle in a new home this Thanksgiving may find a more favorable market, as an increasing number of U.S. metros have moved from seller‑dominated to buyer‑friendly conditions.
Realtor.com economists report that in early summer seven of the top 50 metros—Miami, Austin, Orlando, and others—crossed the six‑month supply threshold that signals a buyer’s market. The months‑of‑supply metric shows how many months it would take to sell all listed homes at the current pace; a higher number means a slower market and more leverage for buyers. A market is considered a seller’s market when supply falls below four months, balanced between four and six, and a buyer’s market when it exceeds six.
By August, the list of buyer‑friendly metros had grown to 11, adding Denver, Nashville, Raleigh, and Houston. The data were derived from August sales records in Realtor.com’s public database, incorporating both existing‑home and new‑home transactions and MLS figures where available.
Realtor.com senior economist Jake Krimmel notes that, aside from New York City, all current buyer markets cluster in the South and West. He attributes this to rising inventory and a slower pace over the past year, especially during the summer.
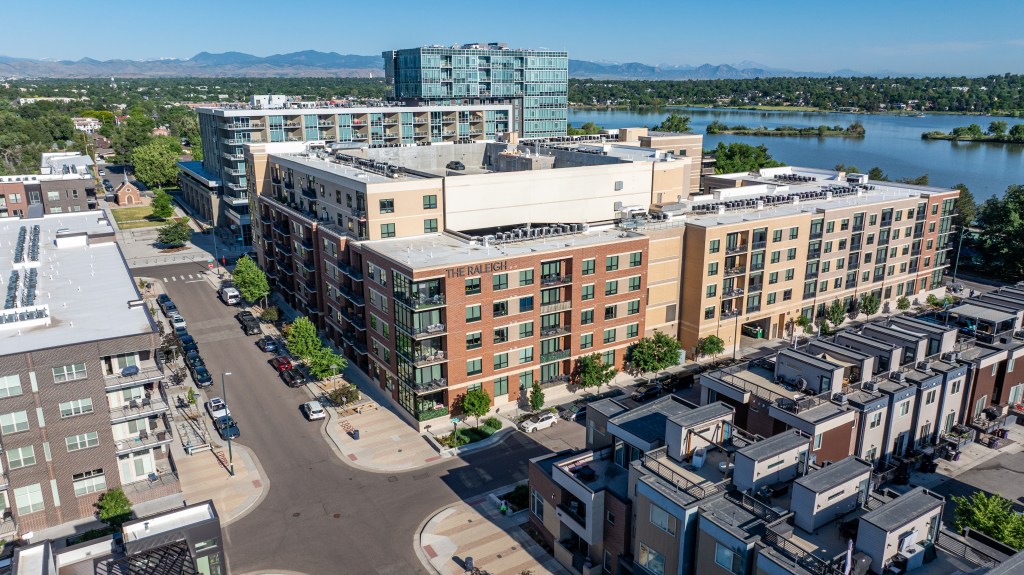
**Denver** began the summer in balanced territory with 4.9 months of supply, ending it as a buyer’s market at 6.1 months. The city has led the nation’s top 50 metros in inventory recovery, with a 64.2% increase in for‑sale homes compared to six years ago; by October that share had eased to 57% but Denver remained the leader. Real‑estate agent Heather O’Leary says buyers now have more choices and stronger negotiating power thanks to the glut of inventory.
**Nashville** saw its months of supply rise from 5.8 in June to 6.4 in August, driven by a 20.7% jump in new listings. The average time a home stayed on the market increased by 21 days year‑over‑year. O’Leary notes that buyers are negotiating beyond price, securing seller concessions such as rate buydowns that can save hundreds on monthly payments. Nashville’s shift from a seller’s to a buyer’s market is largely due to affordability pressures: the median price hit $515,000, and many sellers overprice homes that sit unsold. Higher mortgage rates have also slowed demand, leading to more listings. Despite this, Nashville remains resilient thanks to low unemployment, modest property taxes, no state income tax, and a vibrant cultural scene.
**Orlando** experienced the steepest increase in months of supply, rising from 6.9 to 8.7, propelling it to second place on the buyer‑market list and overtaking Austin. Sellers who bought during the 2020‑22 frenzy are finally deciding to sell, and new construction plus a natural seasonal slowdown have added to inventory. Prices are stabilizing, giving buyers less pressure and a better chance to secure a home in the fall, when competition eases and motivated sellers remain.
**Raleigh** entered buyer territory with 6.1 months of supply, up from 5.6 two months earlier. It recorded the third‑highest annual inventory growth among the 50 largest markets and the strongest growth in newly listed homes. As inventory piled up, many sellers delisted, ceding ground to buyers.
**Houston** crossed the six‑month threshold late in summer, rising from 5.7 in June. Like Raleigh and Nashville, it saw a strong increase in fresh listings, expanding its inventory. Krimmel says these cities followed a predictable trend: affordability issues, high interest rates, and sellers’ overly optimistic outlooks kept the summer market sluggish, allowing inventory to build.
**Miami** remained the nation’s top buyer market, with months of supply climbing from 9.7 to 10. The median list price fell 5.7% from the previous year to $500,000.
**Riverside, California** secured the fourth spot on the national buyer‑market list, with supply rising to 7.3 months in August from 6.1 in June. The city’s inventory grew more than 24% over the same period in 2024, and homes stayed on the market 16 days longer than the previous year, marking the second‑largest slowdown in sales pace after Nashville.
**Austin** continued to deepen its buyer‑market status, with months of supply increasing from 7.1 to 7.4 amid a softening market.
**Las Vegas** has not yet entered buyer territory but is moving in that direction. Its supply rose from 4.3 months in June (balanced) to 5.7 months in August, approaching the six‑month benchmark as inventory grew and the market slowed.
Overall, the shift toward buyer‑friendly conditions across these metros gives home shoppers more inventory, longer decision times, and greater bargaining power. Sellers are adjusting by cutting prices, offering concessions, or renovating, while buyers can now negotiate beyond price to secure favorable terms. The trend reflects broader affordability challenges, higher mortgage rates, and a market that is finally finding balance after the pandemic‑era boom.