C
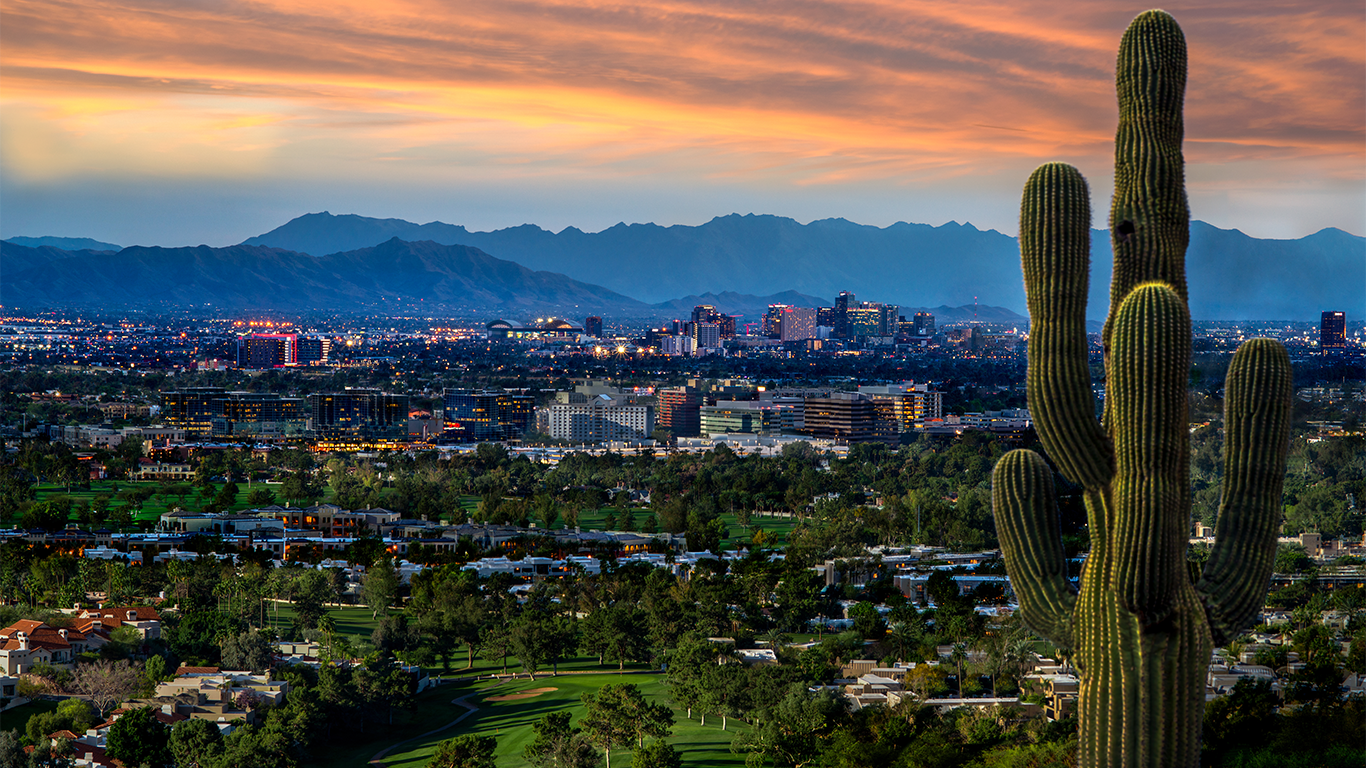
limate Change Threatens Phoenix Real Estate, Trillions at Stake
A new analysis by Zillow reveals that trillions of dollars' worth of US real estate is vulnerable to climate-related disasters such as floods, fires, and extreme winds. In Phoenix alone, nearly $400 billion in real estate is at risk.
The study found that homes with major wind risk are valued at over $17 trillion, while those with major fire risk total $9.1 trillion. Flood-prone properties are worth a cumulative $7 trillion. The New York City metro area stands out as the most vulnerable to flood and extreme wind risks, with a total value of homes at risk exceeding $3 trillion.
Despite growing awareness of climate risks, many high-risk areas remain desirable and often have higher home values. In fact, homes with extreme flood risk are worth nearly 22% more than those with minor risk scores. The median list price for homes with extreme fire risk is a staggering 49% higher than those with minor fire risk.
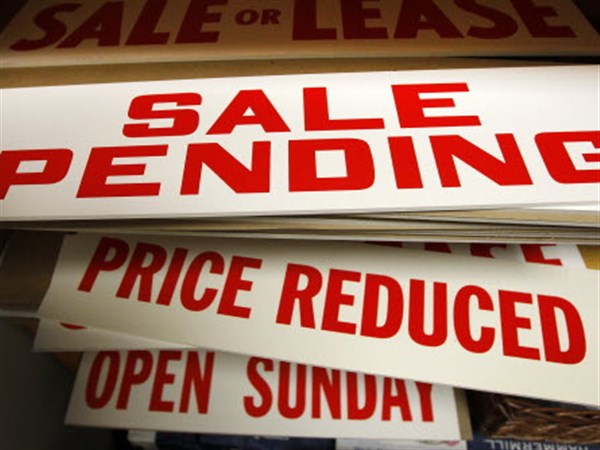
Homebuyers can now explore climate risk data on Zillow's search map and directly on for-sale listings, complete with risk scores and interactive maps. This information helps buyers and sellers evaluate long-term factors affecting homeownership, such as safety, resilience, and costs.
The top 11 metro areas with at least $100 billion in residential real estate at major fire risk include six California cities. The Los Angeles metro has the highest total value of homes at risk from fires, totaling $831 billion.
Here's a breakdown of the top 20 metro areas by market size, including their total value of homes at risk from floods, fires, and extreme winds:
1. United States: $9.146.9B (fire), $7.042.8B (flood), $17.286.0B (wind)
2. New York City, NY: $68.6B (fire), $593.0B (flood), $3.031.3B (wind)
3. Los Angeles, CA: $831.4B (fire), $286.6B (flood)
4. Chicago, IL: $4.0B (fire), $117.5B (flood)
5. Dallas, TX: $230.9B (fire), $60.9B (flood), $755.3B (wind)
6. Houston, TX: $55.8B (fire), $261.4B (flood), $790.4B (wind)
7. Washington, DC: $36.7B (fire), $109.0B (flood), $125.2B (wind)
8. Philadelphia, PA: $19.7B (fire), $80.1B (flood), $781.1B (wind)
9. Miami, FL: $70.0B (fire), $579.7B (flood), $1.432.8B (wind)
10. Atlanta, GA: $28.5B (fire), $65.7B (flood), $345.7B (wind)
11. Boston, MA: $152.6B (fire), $1.021.7B (flood)
12. Phoenix, AZ: $336.0B (fire), $49.7B (flood)
13. San Francisco, CA: $385.4B (fire), $192.8B (flood)
14. Riverside, CA: $551.1B (fire), $73.9B (flood)
15. Detroit, MI: $0.1B (fire), $37.1B (flood)
16. Seattle, WA: $0.2B (fire), $71.9B (flood)
17. Minneapolis, MN: $7.8B (fire), $34.1B (flood)
18. San Diego, CA: $266.7B (fire), $50.8B (flood)
19. Tampa, FL: $63.1B (fire), $171.7B (flood), $492.0B (wind)
20. Denver, CO: $249.6B (fire), $26.3B (flood)
Homebuyers and sellers can now make informed decisions about long-term factors affecting homeownership by exploring climate risk data on Zillow's search map and directly on for-sale listings.