N
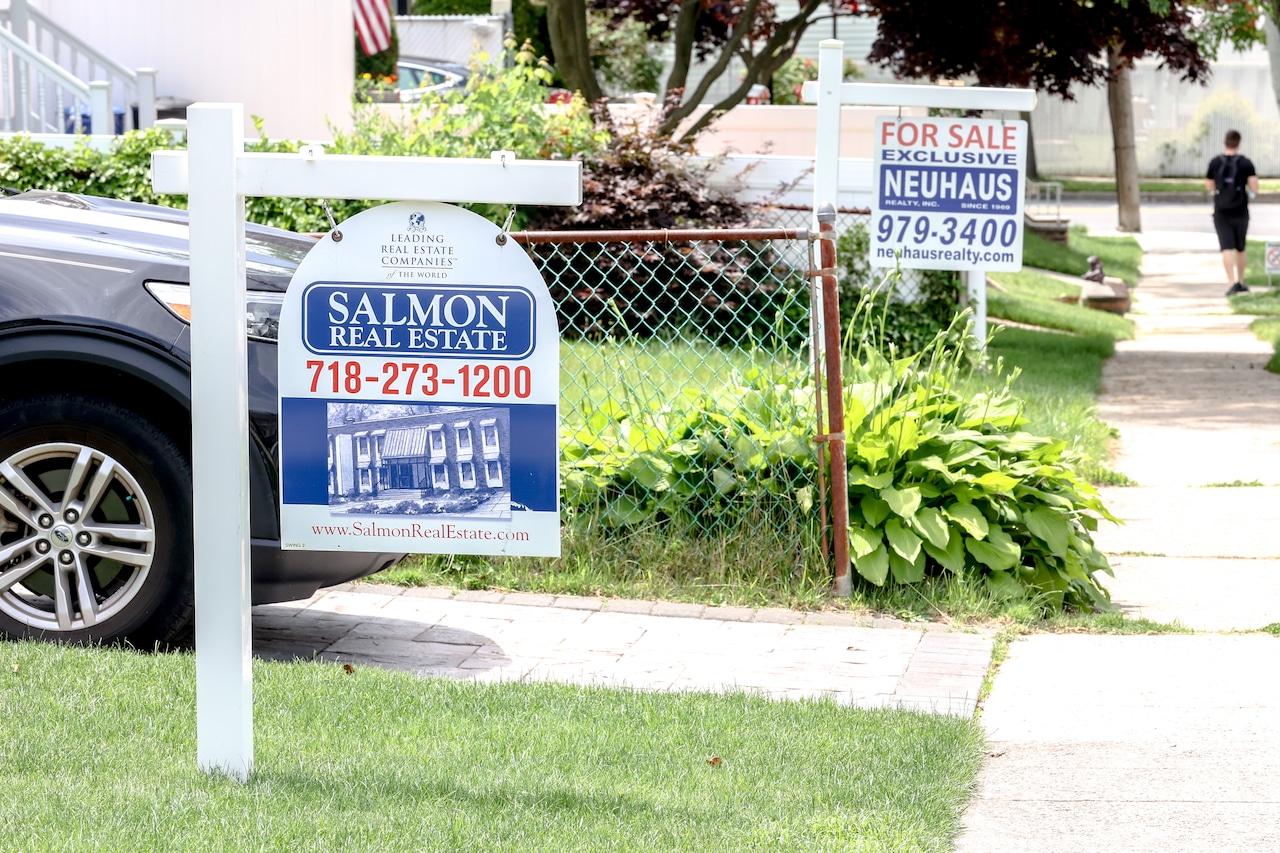
ew data shows Staten Island is NYC’s most mortgage‑dependent market. In the first five months of 2025, about 56% of city homes were bought with a loan, but in Staten Island that figure jumps to 77%. The split between cash and financed purchases reveals buyer types: cash buyers are usually investors or high‑net‑worth individuals seeking speed and leverage, while mortgage buyers are typically first‑time buyers, families, or long‑term residents buying primary homes.
In Manhattan, 60% of sales closed without financing—the highest share in the city—highlighting how concentrated wealth and liquidity shape ownership patterns. Cash deals in the most competitive boroughs signal purchasing power and a preference for upscale properties. In contrast, outer boroughs, including Staten Island, see fewer cash transactions. No neighborhood in Staten Island exceeded a 50% cash‑transaction threshold, underscoring its mortgage‑heavy market. However, areas such as Prince’s Bay and Rossville show cash premiums, suggesting limited investor activity and newcomers from pricier boroughs like Brooklyn.
The data indicates a shifting ownership landscape across NYC, but no single buyer archetype dominates. Together, the purchasing patterns provide insight into who is buying in the city now and how those choices are reshaping ownership across the five boroughs.
If you buy a product or create an account via a link on our site, we may receive compensation. By using this site, you agree to our User Agreement and acknowledge that your clicks, interactions, and personal data may be collected, recorded, and stored by us and third‑party partners in accordance with our Privacy Policy.