S
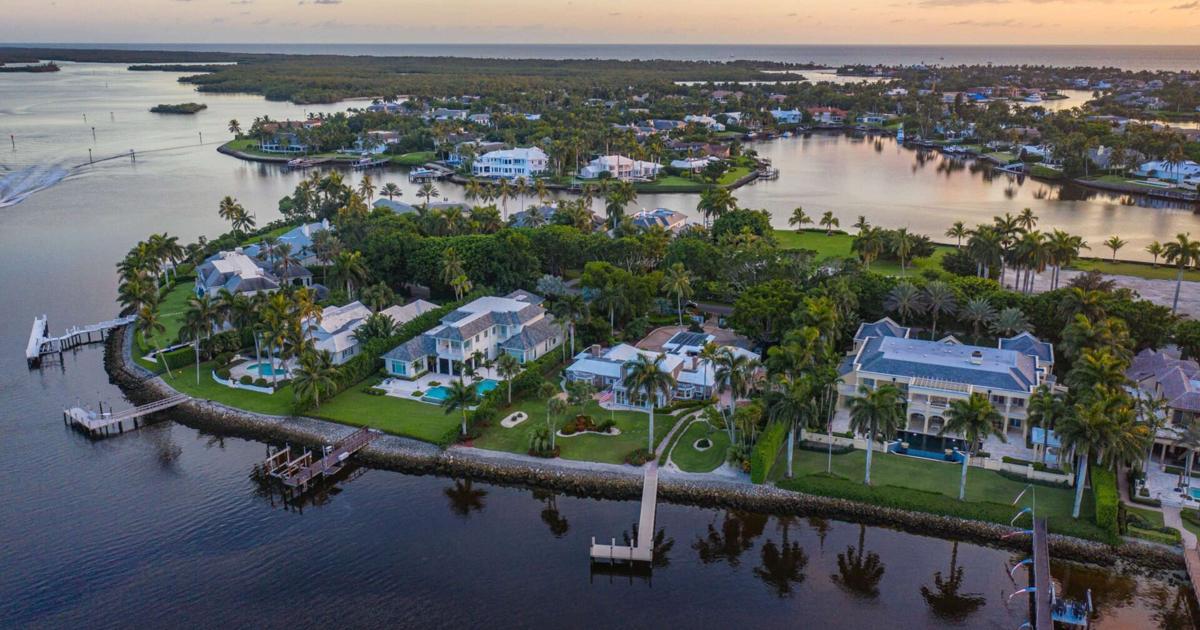
outhwest Florida’s luxury market is charting a path that diverges from the national slowdown, according to Realtor.com’s October Luxury Housing Market Report. In the Cape Coral–Fort Myers area, the 90th‑percentile price fell 7.8 % year‑over‑year to roughly $1.06 million, the steepest drop in the country. Days on market edged higher, suggesting sellers are still adjusting to the new price reality. Just 45 miles south, Naples–Marco Island remains one of the country’s priciest luxury markets, with the entry point for the top 10 % of listings at about $3.44 million—a 2.1 % decline. The ultra‑affluent segment there is still strong, ranking seventh nationally and averaging nearly 2,000 million‑dollar sales last year, a sign that high‑net‑worth buyers view Collier County as a long‑term investment rather than a speculative play.
Realtor.com Chief Economist Danielle Hale notes that the national luxury benchmark slipped 2.2 % to $1.22 million, but the underlying trend is a split between markets where prices accelerate and sales speed up, and those where price corrections are reigniting demand. “The national average for luxury pricing is oversimplifying a more dynamic, city‑by‑city story,” Hale says. “In markets where prices are accelerating and homes are selling faster, buyers are clearly competing. The most compelling trend this month is the effective price correction in other high‑end metros.”
North Port–Bradenton–Sarasota, just north of Fort Myers, led the country in luxury price growth, surging nearly 20 % to $1.67 million. The region continues to attract affluent buyers seeking newer construction, coastal access, and relatively lower prices than Naples. Three metros—Heber, Utah; Boise City, Idaho; and Minneapolis—stand out as true “high‑velocity” markets, with luxury prices rising while homes sell faster. “When prices rise year‑over‑year while homes are simultaneously selling faster, it means buyers are not just willing to meet the price—they are competing for limited inventory,” Realtor.com senior economist Anthony Smith says.
Elsewhere, price corrections are resetting expectations and accelerating sales. Bridgeport–Stamford–Danbury, Connecticut, saw luxury prices drop 7.5 % while days on market plunged 42.5 %. Charleston, South Carolina, and Atlantic City, New Jersey, posted similar declines. At the extreme, Kahului–Wailuku, Hawaii, recorded the sharpest decline in the nation, nearly 20 %, pulling its luxury threshold down to $3.79 million. Even with national price softening, the ultra‑luxury tier—the top 1 % of listings—showed slight stabilization, rising 1 % month over month to $5.41 million.
The diverging paths of Cape Coral–Fort Myers, Naples–Marco Island, and North Port underline a broader regional reality: high‑end demand remains strong, but the definition of luxury and its pace vary sharply from one coastal market to the next.
**Largest year‑over‑year price declines (top 5)**
1. Kahului–Wailuku, Hawaii – $3.79 M, –19.9 %
2. Charleston–North Charleston, S.C. – $1.99 M, –13.1 %
3. Atlantic City–Hammonton, N.J. – $2.32 M, –13.0 %
4. Austin–Round Rock–San Marcos, Texas – $1.33 M, –11.0 %
5. Port St. Lucie, Fla. – $1.01 M, –9.0 %
**Top 10 luxury markets by 90th‑percentile listing price (2024)**
1. Heber, Utah – $6.50 M, +8.4 %
2. Key West–Key Largo, Fla. – $4.82 M, +1.7 %
3. Bridgeport–Stamford–Danbury, Conn. – $4.25 M, –7.5 %
4. Los Angeles–Long Beach–Anaheim, Calif. – $3.99 M, –6.3 %
5. Kahului–Wailuku, Hawaii – $3.79 M, –19.9 %
6. San Jose–Sunnyvale–Santa Clara, Calif. – $3.75 M, –6.2 %
7. Naples–Marco Island, Fla. – $3.44 M, –2.1 %
8. New York–Newark–Jersey City, N.Y.–N.J. – $3.02 M, –7.7 %
9. Oxnard–Thousand Oaks–Ventura, Calif. – $3.00 M, –6.5 %
10. San Diego–Chula Vista–Carlsbad, Calif. – $2.89 M, –2.8 %