H
omebuyers’ income determines how much they can spend on a house, and the impact varies by state.
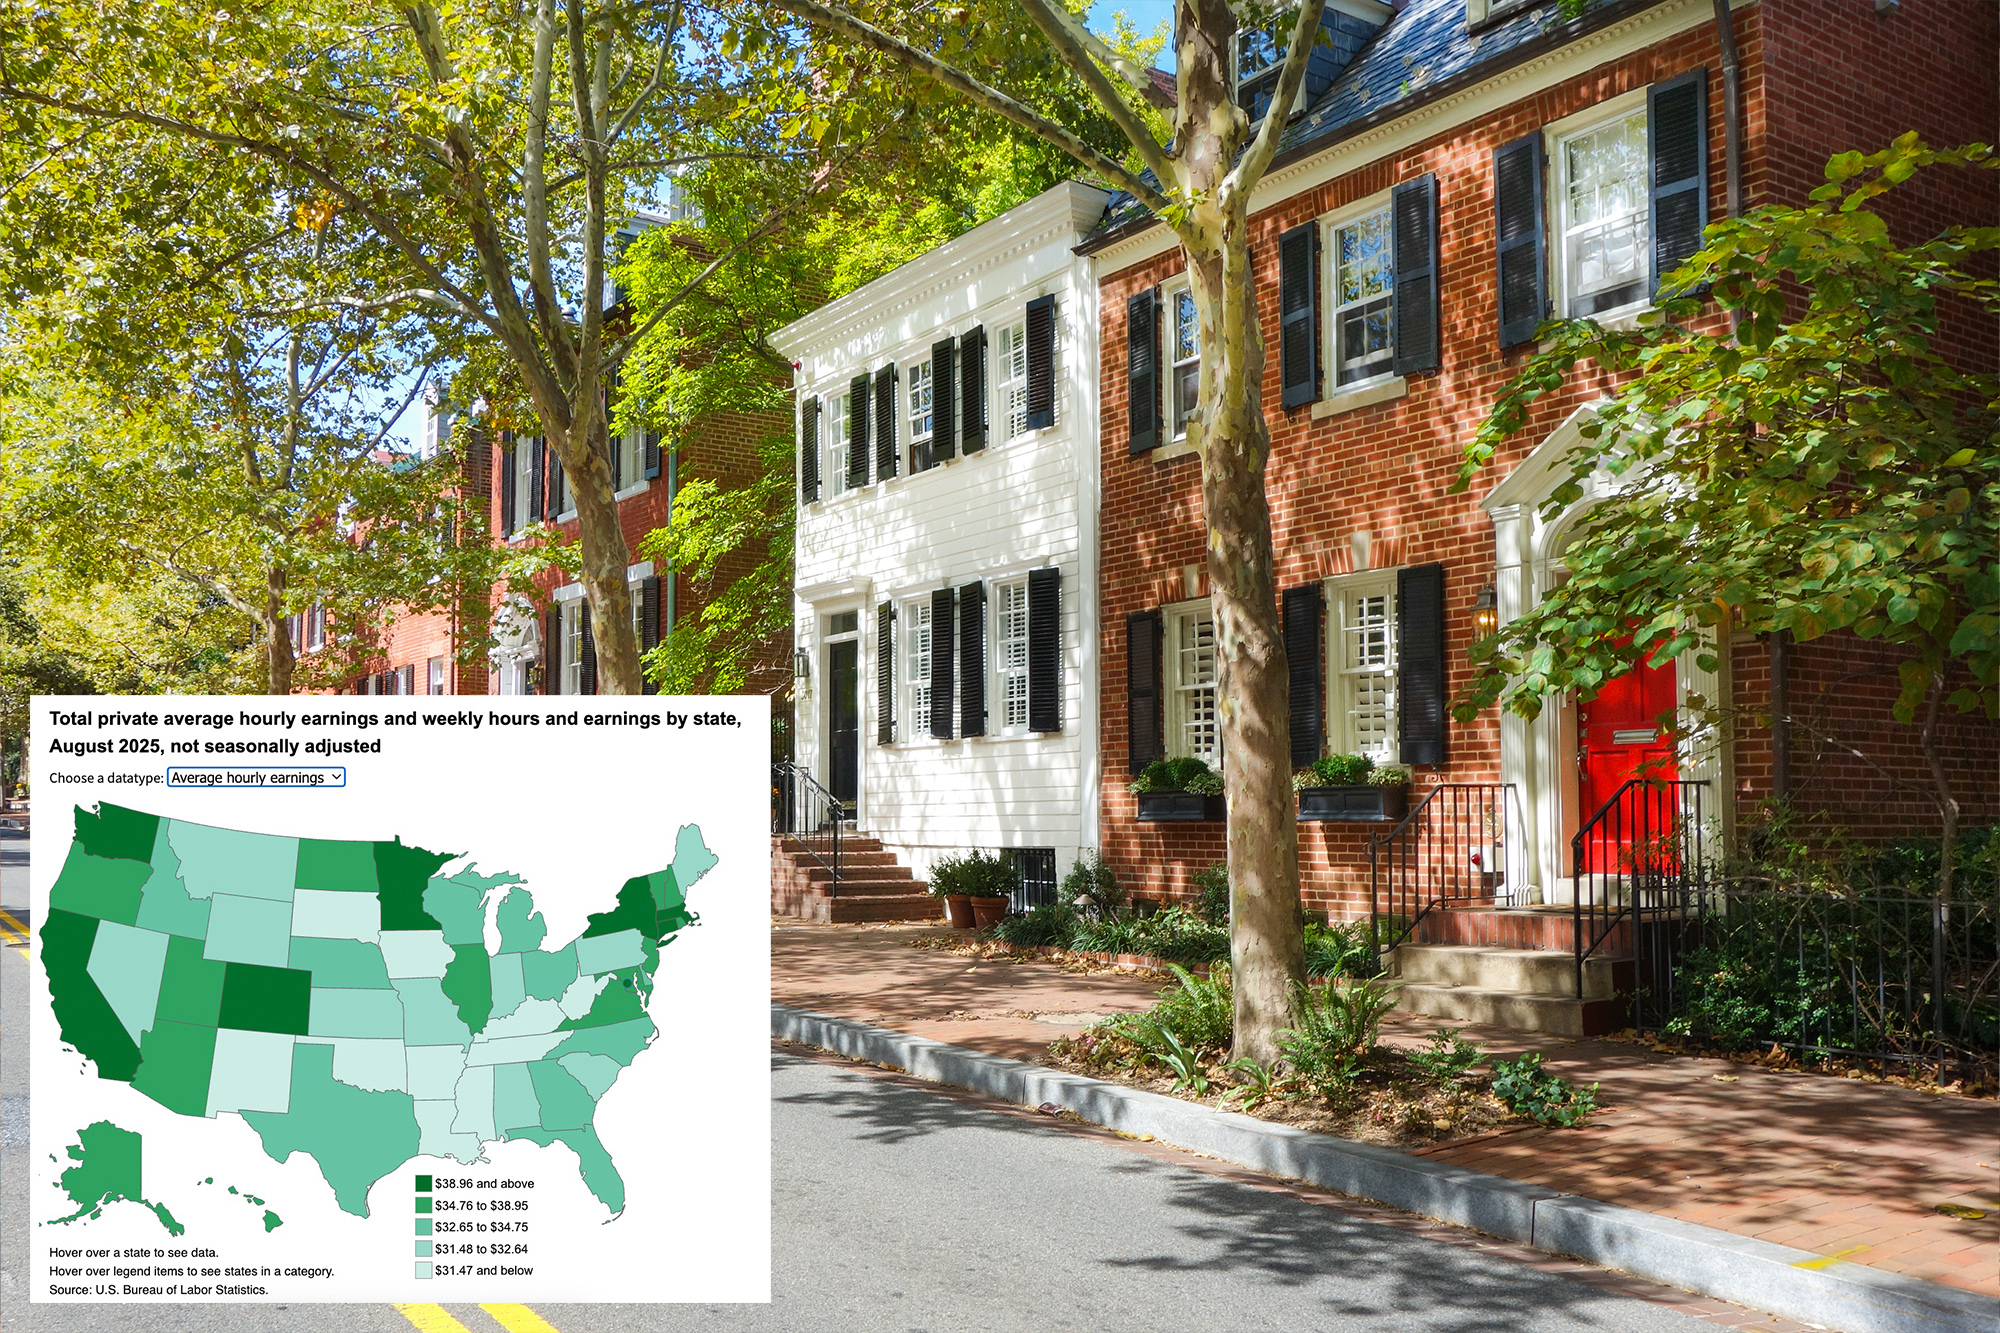
The U.S. Bureau of Labor Statistics (BLS) publishes average hourly earnings for each state, a key driver of local housing markets.
**Key insights**
- **Higher wages → more mortgage approvals → more competition → higher prices** – Ben Mizes, real‑estate agent, explains.
- **Income and property values move together** – Bruce Ailion, Re/Max attorney, notes.
- **High‑earning states often face affordability gaps** – Hannah Jones, Realtor.com analyst, says wage growth lags behind rising costs.
- **Low‑earning states usually see better wage‑price alignment** – Jones adds that many of the lowest‑pay states keep prices within reach.
- **Investors target cheaper markets** – Ron Myers, agent‑investor, points out that lower wages create opportunities for affordable‑housing purchases.
**Top five high‑pay states (30% rule)**
| Rank | State | Avg. hourly wage | Median listing price | Max affordable price (20% down) | Price gap |
|------|-------|------------------|----------------------|---------------------------------|-----------|
| 1 | Washington, DC | $54.23 | $584,975 | $574,314 | +1.9% |
| 2 | Washington | $42.30 | $639,975 | $447,971 | –42.9% |
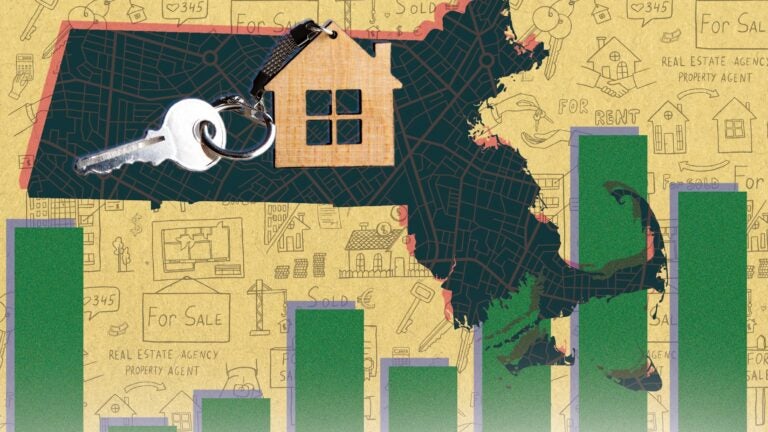
| 3 | Massachusetts | $41.74 | $749,450 | $442,040 | –69.5% |
| 4 | California | $41.09 | $740,368 | $435,157 | –70.1% |
| 5 | Minnesota | $39.53 | $379,950 | $418,636 | –9.2% |
*Minnesota is an outlier, offering high wages and prices below the affordability ceiling, unlike California and Massachusetts where prices far exceed local earning power.*
**Bottom five low‑pay states (30% rule)**
| Rank | State | Avg. hourly wage | Median listing price | Max affordable price (20% down) | Price gap |
|------|-------|------------------|----------------------|---------------------------------|-----------|
| 1 | Mississippi | $28.10 | $299,000 | $297,588 | +0.5% |
| 2 | New Mexico | $29.14 | $399,900 | $308,602 | –29.6% |
| 3 | Arkansas | $29.62 | $305,750 | $313,686 | –2.5% |
| 4 | Louisiana | $29.71 | $275,750 | $314,639 | –12.4% |
| 5 | West Virginia | $29.88 | $257,000 | $316,439 | –18.8% |
*In most low‑income states, home prices stay within or below the 30% income threshold, except for New Mexico where prices exceed local wages.*
**Takeaway**
Income levels shape affordability: high earners can afford larger or better‑located homes but may still struggle in expensive markets, while lower earners often find prices more in line with wages. Investors frequently step in where wages are low, anticipating future appreciation as incomes rise.