S
eptember saw the most home delistings in a decade, with 85,000 U.S. sellers pulling their properties off the market—a 28 % jump from last year and the highest September figure in eight years. Nationwide, 5.5 % of all listings were removed, the largest share since 2016, and 1 in 5 of those homes was relisted within three months.
**Key Definitions (Redfin)**
- *Delisted*: a listing that has been off the market for more than 31 days without a sale or pending contract.
- *Stale*: a listing that has been on the market for at least 60 days without a contract.
- *Risk of loss*: a home originally listed for no more than 10 % above its purchase price.
**Trends and Drivers**
- **Stale listings** now top 70 % of all U.S. homes on the market, with the average delisted property having sat for 100 days.
- **Demand slowdown**: high mortgage rates, steep prices, and economic uncertainty keep buyers on the sidelines, prompting sellers to pull listings rather than lower prices.
- **Loss aversion**: 15 % of delisted homes were at risk of selling at a loss, the highest share in five years.
- **Rental alternative**: many owners prefer to rent out their homes instead of selling for less than desired, planning to relist when conditions improve.
- **Inventory growth**: active listings rose 8 % YoY in September, the highest level for the month since 2019, creating more opportunities for delistings.
**Impact on Prices**
Despite a buyer‑market environment—pending sales down 2 % and inventory up 8 %—home prices still rose 2 % YoY. Delistings tighten supply, keeping prices elevated as sellers resist price concessions.
**Seller Profile**
- 47 % of delistings came from owners who bought within the last five years, a disproportionately high share compared to 37 % of all listings.
- Recent buyers (2020‑2023) are especially reluctant to accept lower offers, often holding out for a price that matches the pandemic‑era seller’s market they experienced.
**Metro Highlights (September 2025)**
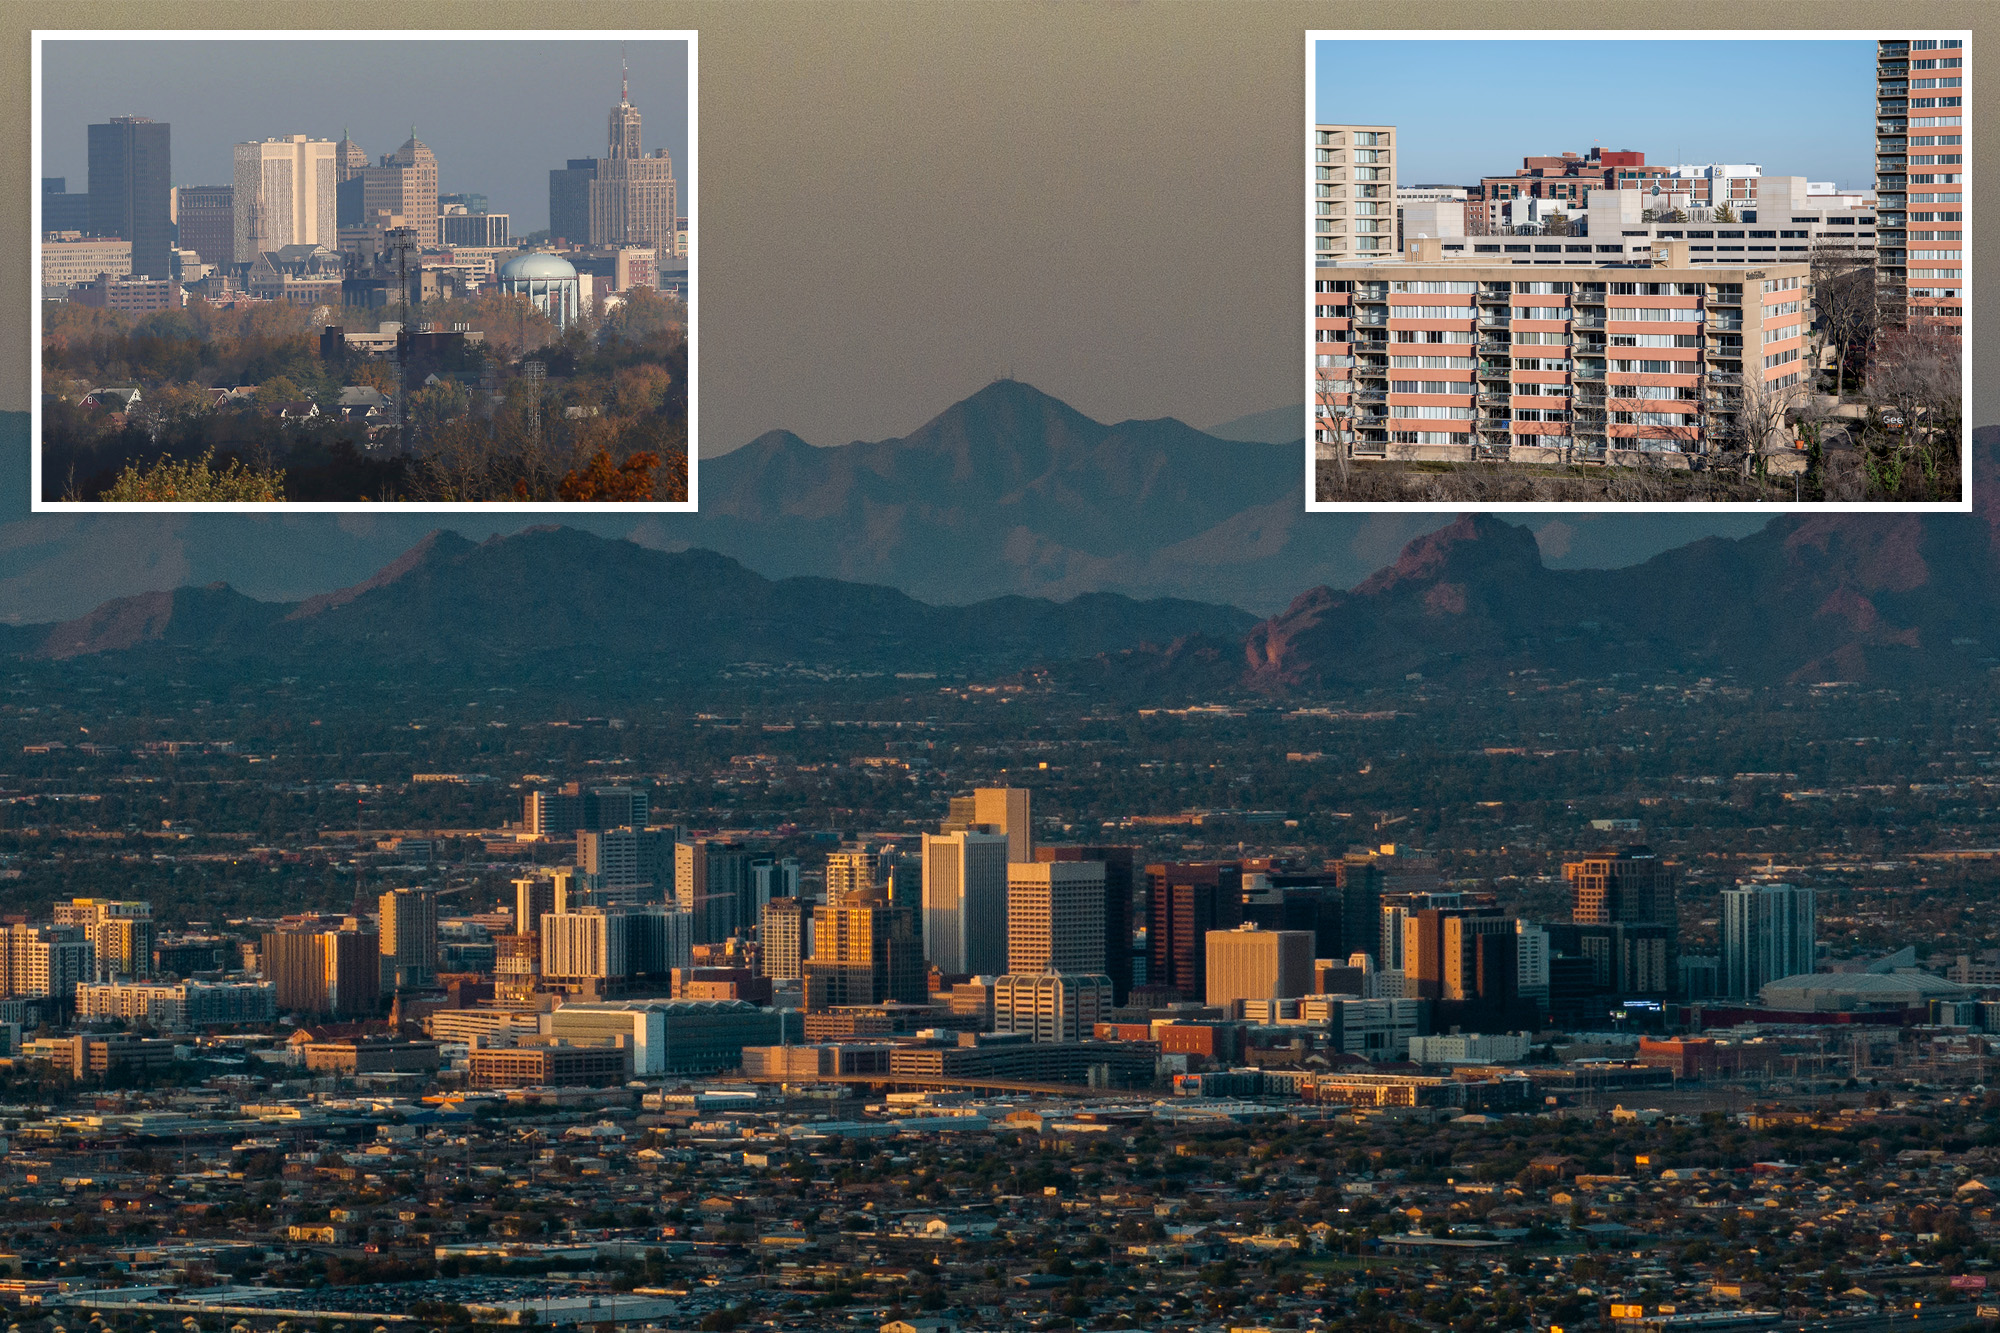
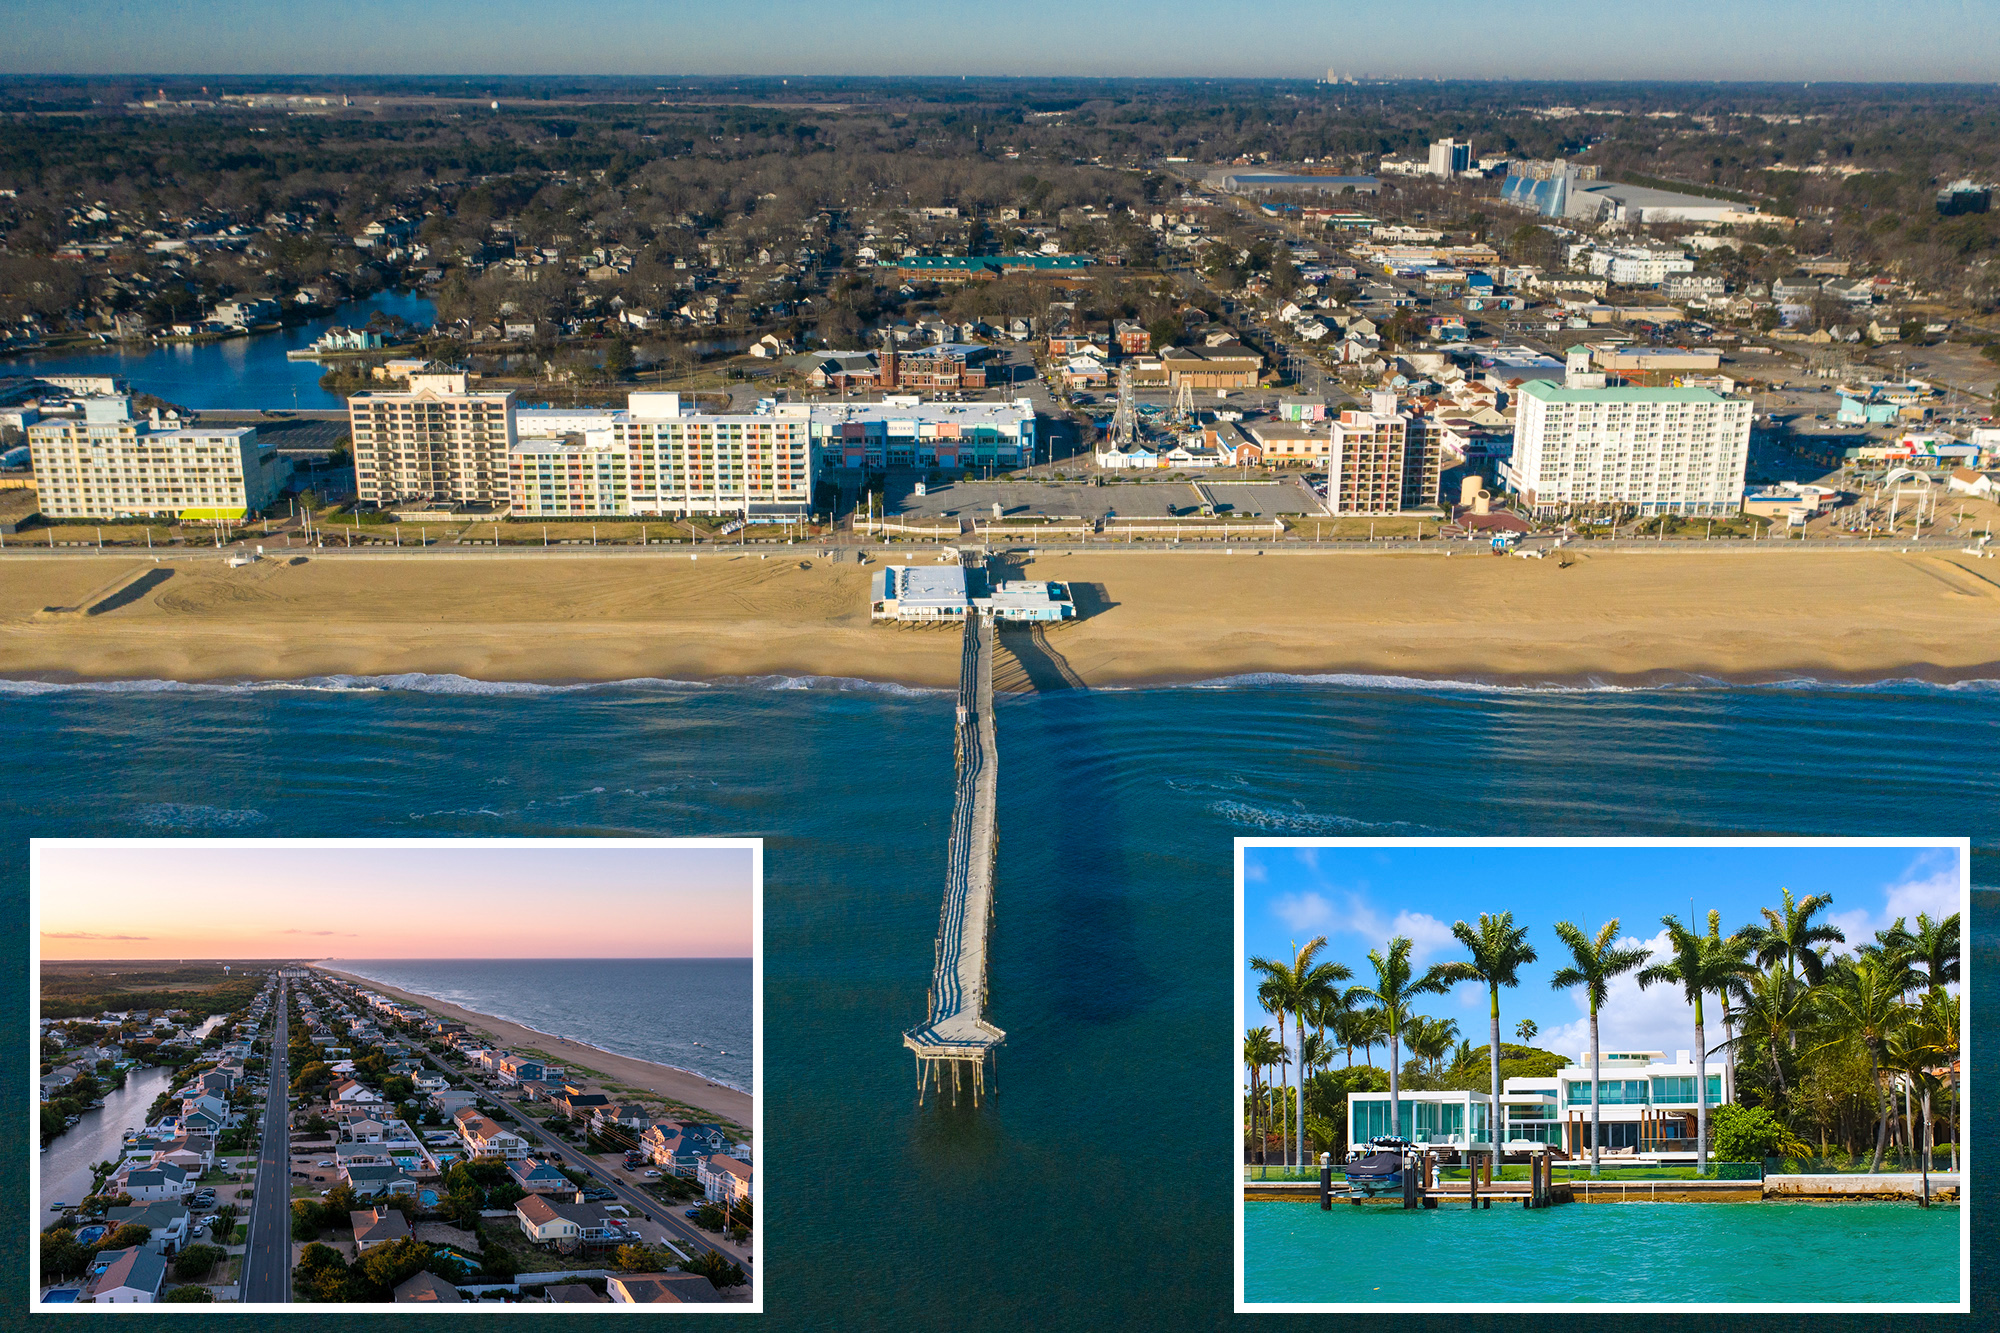
- Highest delisting growth: Virginia Beach (74.5 % YoY), Washington, D.C. (53.9 %), San Jose (53.3 %).
- Lowest growth: St. Louis (‑12.4 %), Nassau County (‑7.2 %), Chicago (‑1 %).
- Florida and Texas lead in stale listings: Miami (84.6 %), Fort Lauderdale (84.6 %), Austin (82.8 %).
- Miami’s delistings account for 7.8 % of all listings, the largest share among the top 50 metros.
**Re‑listing Rates**
- 20 % of homes pulled in July were relisted, 18 % of June delistings followed the same pattern.
- Of July delistings that returned to the market, 31.6 % have sold, indicating a strategic “price reset” approach.
**Summary**
Delistings have surged since spring 2024, peaking at 39 % YoY in June 2025, and are now outpacing overall listing growth. Sellers, especially those who purchased recently, are pulling homes off the market to avoid low offers, keep inventory tight, and preserve price levels. The trend is most pronounced in Florida, where stale listings and delistings are highest, and in metros like Virginia Beach and Washington, D.C., where delisting activity has exploded.