T
he 2025 Profile of Home Buyers and Sellers from the National Association of REALTORS® shows a housing market split into two stark camps. Equity‑rich, all‑cash buyers dominate, while first‑time buyers—now a record low—are pushed to the sidelines by affordability hurdles.
**1. First‑time buyers hit a historic low**
Only 21 % of purchases are by first‑time buyers, the smallest share since 1981. Before 2008 they usually made up about 40 % of sales. Inventory shortages and high costs keep many out. The median age of first‑time buyers is 40, up from the late 20s in the 1980s, and the median down payment is 10 %—the highest for new buyers since 1989. Savings are the main source (59 %), followed by 401(k)s or IRAs (26 %) and gifts or loans from relatives (22 %). The decline in FHA and VA loans (down from 55 % in 2009 to 28 % in 2025) signals a shrinking role for low‑down‑payment programs, underscoring the need to increase housing supply.
**2. All‑cash purchases soar**
All‑cash deals now average 26 % of sales, a sharp rise from the <10 % seen between 2003‑2010. Cash buyers often use equity from a prior sale and can bypass mortgage constraints, giving them a competitive edge in a high‑interest environment.
**3. Down payments climb**
Median down payments are at a decade‑high: 19 % overall, 10 % for first‑time buyers and 23 % for repeat buyers. Repeat buyers are especially strong, with 23 % down and nearly one‑third paying all cash. Their equity cushion—average $140,900 in wealth over the past five years—fuels this power.
**4. Agents remain indispensable**
Eighty‑eight percent of buyers used an agent, and 91 % of sellers did the same, the highest rates on record. Buyers value agents for home selection, negotiation, and paperwork; 76 % of first‑time buyers credit agents for demystifying the process. Sellers prioritize marketing, pricing, and speed to close.
**5. FSBOs at an all‑time low**
Only 5 % of homes sold were For Sale By Owner, while 91 % involved an agent. FSBOs typically sell for less (median $360,000 vs. $425,000 for agent‑assisted homes). Owners usually sell to friends or relatives or to avoid commissions.
**6. Repeat buyers wield financial muscle**
Repeat buyers’ median down payment is 23 %, and many skip financing entirely. The average seller has owned their home 11 years, providing a deep equity reserve. Equity gains of $140,900 over five years illustrate the wealth built by long‑term owners.
**7. Fewer households with children**
Only 24 % of buyers have children under 18, down from 58 % in 1985. Child‑bearing rates and high childcare costs limit savings. Married couples now represent 61 % of buyers, with single women at 21 % and single men at 9 %. The buyer demographic is shifting toward more diverse, non‑traditional households.
**8. Buyers and sellers are aging**
The median age of first‑time buyers is 40; repeat buyers are 62; sellers average 64. Baby boomers (60‑78) dominate the market, bringing stronger financial positions and longer‑term horizons.
**9. Longer home tenure**
Buyers now expect to stay 15 years on average, with 28 % calling their purchase a “forever home.” The median time a homeowner stays before selling is 11 years, a record high. The “starter home” mindset has faded.
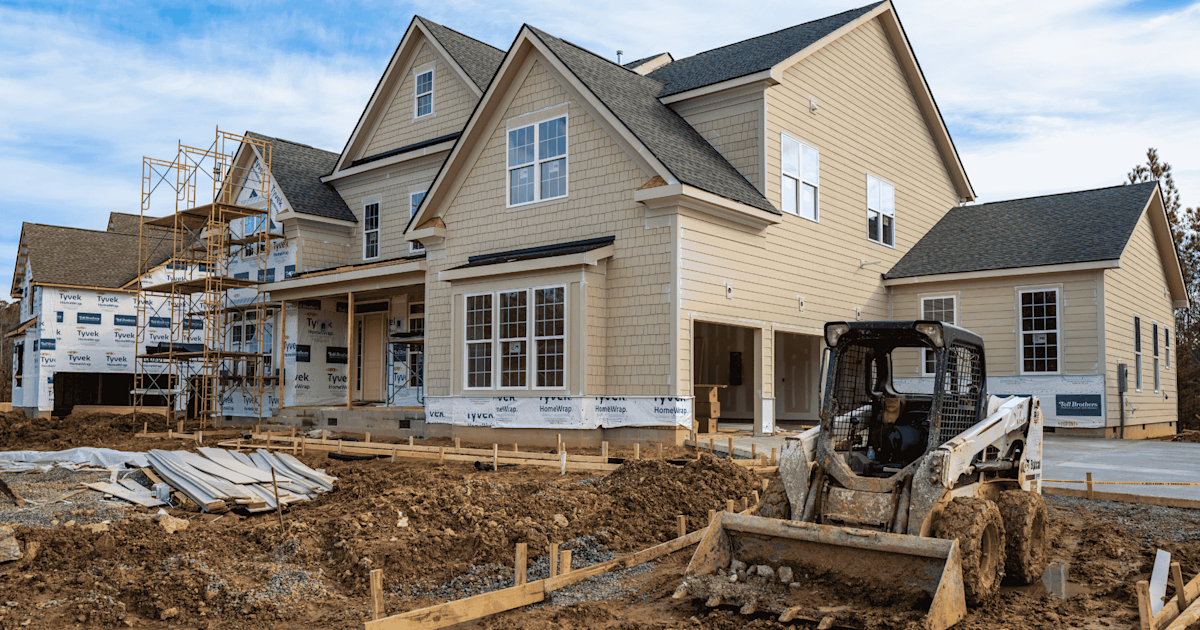
**10. New‑home purchases rise**
New‑home sales climbed to 16 % of all purchases, the highest since 2006, while existing‑home sales fell to 84 %. Builders offer incentives—price cuts, mortgage buydowns—to attract buyers who want turnkey properties and customization options. Existing‑home buyers cite value, lower price, and character.
**Source:** 2025 Profile of Home Buyers and Sellers, National Association of REALTORS®