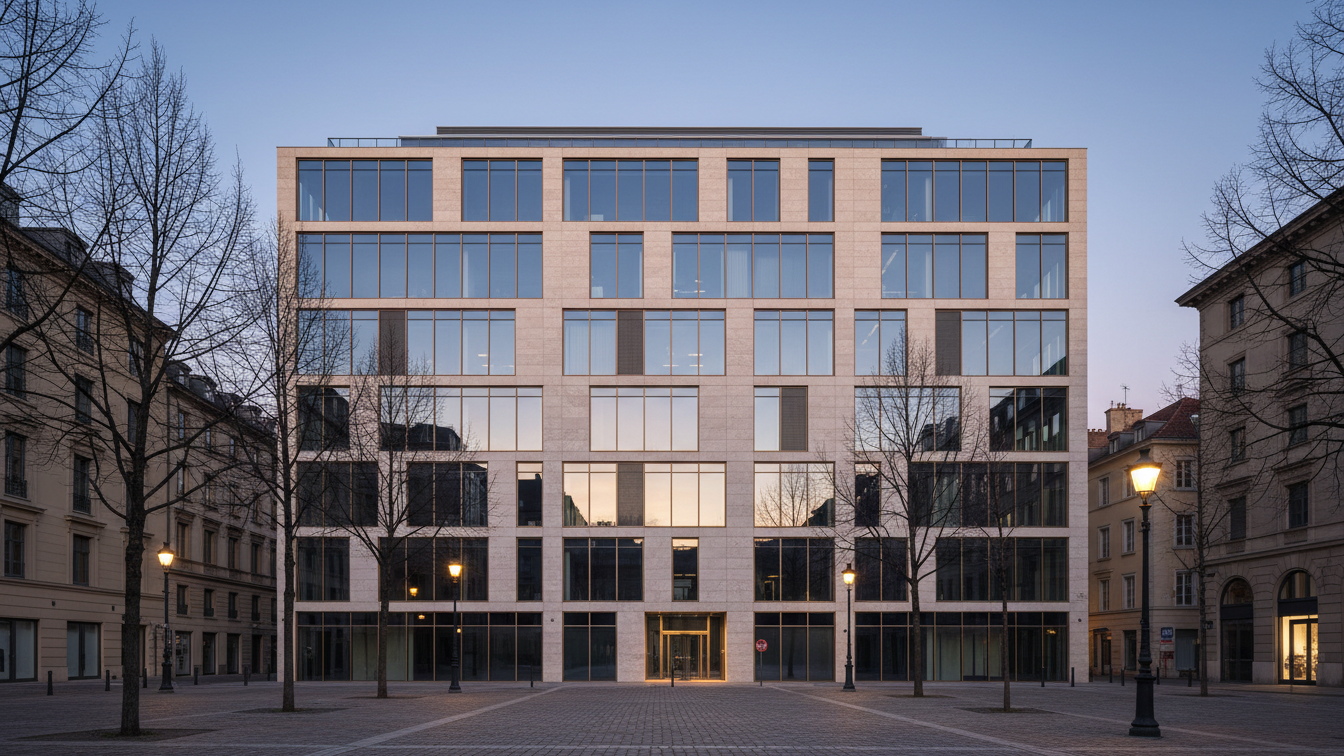
The office market is on the upswing. The available data leaves little room for arguments to the contrary. Net absorption nationwide reached 12.6 million square feet in the second quarter, almost doubling the previous quarter and marking the ninth consecutive quarter of positive demand, as reported by CBRE. Leasing activity increased by 16 per cent year-on-year and is on track to surpass 2022, considered the strongest year.
At the same time, the overall vacancy rate fell by 30 basis points to 18.3 per cent, the largest quarterly drop since 2015. Asking rents are experiencing their fastest growth in the last six years. Office investment volume is expected to increase by 16 per cent this year. For an asset class that was written off for five years, this represents a remarkable turnaround.
Averages Obscure Reality
However, these figures reflect an average. And it is precisely within these averages that the market conceals crucial information. The vacancy rate for prime office space is 12.3 per cent, while the overall vacancy rate stands at 18.3 per cent. This difference of 600 basis points is not a rounding error between comparable properties; these are two distinct markets aggregated under one label. For example, the vacancy rate for prime space in Midtown Manhattan is 2.2 per cent, whereas a suburban office park from the 1980s an hour away is practically unfinanceable. Both are included in the same national statistics that most investors rely on to describe the recovery.
The industry has largely grasped the core message: 'Flight to Quality' is the current consensus. The resulting recommendation is well-known: buy premium space, avoid standard properties, and base valuations on the respective class, not the average. This recommendation is correct but incomplete. The aspect left unaddressed is the one that generates actual returns.
The Operability Factor
The common interpretation treats the divide as a function of physical attributes such as location, build year, layouts, and amenities – factors visible during a viewing and priced at acquisition. According to this logic, a property's classification is fixed at the time of transaction. However, the facts do not support this. The biggest performance differences are not seen between segments, but within them.
At Leesman, a company that measures workplace experience based on over a million employee responses, we consistently find that properties that appear identical on paper are at opposite ends of the performance scale. In a study of 1,322 workplaces and 476,341 responses, workplaces with unassigned seating achieved an average Leesman Index of 79 when the space offered genuine variety, and 51.1 when it did not. Same asset class, same nominal strategy. A difference of 27.9 points in the actual functionality of the space for users.
This observation is confirmed by a broader view. Among workplaces with great variety, 65 per cent achieve the top experience band; for those without this variety, it is only 17 per cent. These differences bear no relation to the physical quality of the building fabric. They result solely from how the building is configured, programmed, and operated. The market has not yet fully priced in this aspect. While physical quality is tangible and in demand accordingly, operability is less transparent. It does not appear in tenant lists, offering memorandums, or comparative data. It only becomes apparent 18 months later in renewal behaviour, expansion decisions, and tenant conversations that never lead to a broker search.
- —In a Leesman survey of 129 leading real estate professionals last year, 65 per cent stated that their organisation had not yet found a suitable approach to hybrid work and office use.
- —57 per cent reported that their office space had shrunk in the last 18 months.
- —48 per cent expect further space reduction.
Tenants are still in the process of determining their actual needs. Landlords who can recognise and react to these developments in real time will retain spaces that the tier-based model would not ordinarily assign to them. For investors, this re-frames the original question. If the divide were purely physical, the strategy would be selection, but this strategy is already oversubscribed in this cycle. Premium properties are valued by everyone with the same thesis and the same comparable data. However, if a significant part of the divide is operational, the strategy changes. Then it becomes possible to acquire a property that is on the 'wrong' side of the spread and improve its position. This is the only version of this market where the return is not already priced in.
This is not an argument against quality. Quality is real and has a cumulative effect. It is an argument that quality today represents the entry ticket, no longer the competitive advantage. Selection becomes more relentless quarter by quarter, as long as supply remains at a record low. Buildings don't end up on the 'wrong' side of the line because they were built in the wrong decade, but because no one operates them as if the outcome were still open.